Energy retrofit contributing to
climate-proof built environment
A further tool to climate-proof the built environment, is the newly developed method of resilience-enabling energy retrofit interventions. The method, which is further described in the public report D8.4, consists of an area-specific building typology that classifies buildings according to their structural and non-structural features.

Understanding and classifying building typologies is essential for developing targeted climate-resilient retrofit strategies. A building typology refers to the systematic classification of buildings based on shared architectural, structural, and functional characteristics—such as construction period, number of storeys, structural system, façade type, and layout. These typological attributes enable tailored interventions for improving energy efficiency, enhancing seismic resilience, and ensuring thermal comfort across different contexts.
Building typologies support a range of sectors and objectives:
Policy and planning guidance: Building typologies are embedded in national energy strategies, influencing energy performance certificate (EPC) systems, retrofit incentive schemes, and zoning laws. The JRC’s 2014 overview of building typologies in Europe highlights their central role in implementing long-term renovation strategies.
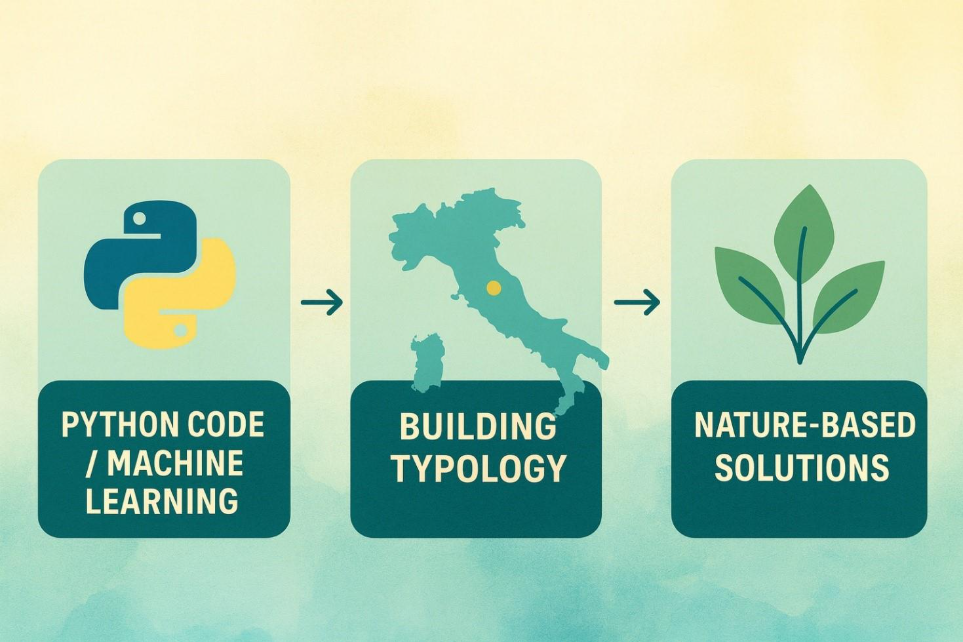
The format of this method is a python code, exploiting machine learning clustering algorithms for the grouping of the buildings. The functions of this code are:

No, it is not accessible. The code can be accessible upon request. Currently, is available as a service offered by the C-EREL (Climate- Environmental REsearch Laboratory) of NCSR Demokritos.
Currently, there is no user group for this application. It can be applied only by the scientific staff of the C-EREL. The area of interest that has been applied and is planned again to be applied in the foreseeable future are EU Municipalities.


The potential clients of this service (e.g. municipalities) can benefit from the application of building typologies against the negative impacts of climate change and natural hazards. From a methodological perspective, building typology supports both top-down (desk-based) and bottom-up (data-driven) approaches. The former relies on existing classifications from literature and institutional sources, while the latter employs computational techniques—such as clustering algorithms—to extract structural patterns from large datasets. The resulting typology enables:
In practical terms, building typologies serve across various domains:
Monitoring and modelling tools: Typologies are integrated into models and databases—such as EPC registries or GIS-based hazard simulations—to project impacts and test adaptation scenarios.
Building typology methodology was developed for and implemented in the Camerino demo case, specifically for its historical center. The study was limited in the characterization of the buildings and divide them in groups, matching the proposed energy solutions, originated from D2.4, to each group, with a focus on nature-based solutions, and examining potential restrictions on the implementations of those solutions due to cultural heritage regulations. Thus, the scope of this research was on a theoretical basis and the potential implementation is intended in Task 11.1.


MULTICLIMACT is a Horizon Europe project supported by the European Commission under grant agreement No 101123538. Views and opinions expressed are however those of the author(s) only and do not necessarily reflect those of the European Union. Neither the European Union nor the granting authority can be held responsible for them.
© 2026 MULTICLIMACT Consortium Partners. All rights reserved.
Steinbeis Europa Zentrum (SEZ) is an independent economic entity within the Steinbeis Foundation. It was founded in March 1990 as the operational unit of the Commissioner for Europe of Baden-Württemberg’s Minister of Economics. SEZ’s core activity is to promote European Research and Technology Development programmes and to support cross-border technology transfer.
SEZ supports small and medium-sized enterprises on behalf of the Ministry of Economic Affairs, Labour and Housing of Baden-Württemberg. At the same time, it supports Universities of Applied Sciences on behalf of the Ministry of Science, Research and the Arts Baden-Württemberg.
Moreover, SEZ is involved in several EU-funded projects (more than 70 in 2023) as either partner or coordinator, taking over tasks related to dissemination, communication, exploitation or financial and administrative project management.
SEZ is project partner and leader of work package 5 Dissemination, Communication and Exploitation of Results. In this context, SEZ is responsible for
Design strategic communication of the project objectives and actions and engagement strategy to achieve optimal visibility activities increasing awareness, engagement, acceptance and fostering uptake of the MULTICLIMACT results, facilitating knowledge transfer and sustainability at Europeans and local level.
Design the D&C tools needed to initiate and implement the strategy. Establishment of activities to the community and dissemination strategy.
Clarification of expected project results, their use beyond the project and partners' contributions, as well as IP management (such as ownership protection and access rights) throughout the project.
The Barcelona City Council will last a pilot test to implement a new drainage pavement for the city. It will be installed on the sea coast bike path of Jordi Girona street, between John Maynard Keynes street and Tillers passeig, in the Les Corts district, and will have a length of 100 meters and 2 meters wide. The test will begin in the beginning of the English quarter. The objective of this initiative is to study the behavior of permeable pavements or linear Sustainable Urban Drainage Systems (SUDS) and evaluate their potential to contribute to responding to urban drainage problems. The test will serve for:
Assess the drainage capacity of the asphalt pavement and its evolution. Assess the quality of the surface runoff streams obtained.
Confirm the results of the experimental tests.
Study the mechanical behavior of the pavement when passing vehicles and passengers.
Study the temperature of the permeable pavement in relation to the traditional pavement (in sec and in mullat) to contribute to reducing the heat effect.
The material has a high and variable infiltration capacity depending on the hydraulic pressure. According to the different studies planned by the UPC, this type of pavement can achieve a potential reduction in surface runoff between 44% and 92%, depending on the geometry and alignment of the road.
The six draining properties can contribute to reducing the risk of flooding in the episodes of large plugs, it is a good complementary alternative to the large actions in collectors and departments of the city.
Nowadays, the six features also make a difference in road safety, as they improve the circulation of cyclists by keeping the surface of the road dry in flood episodes.
In order to collect and analyze the results of this pavement, two recording chambers will be placed to accurately measure and use the samples, one on the west coast that will evaluate the amount of surface runoff captured by the draining pavement; And on the other hand, it will collect the circulating fluid directly over the traditional pavement (non-draining). In this way, a comparative analysis can be carried out. It is also necessary to locate a meteorological station as close as possible to the study area that will include both temperature sensors, relative humidity, wind speed and direction, connectivity and data monitoring.
Along with the bike lane, 10 linear meters will also be paved located in front of the entrance to the University parking lot. This tram is outside the linear circulation of the road, and will only have the objective of checking the mechanical resistance of this permeable pavement in front of heavy vehicles.
The initiative is part of the European project MULTICLIMACT (“MULTI-faceted CLIMate adaptation ACTions”) which aims to improve the resilience, preparedness and response capacity of the built environment against multiple challenges at various scales.
The project presented aims to evaluate the potential benefits of implementing “permeable bike lanes” based on draining pavements, worked in an integral manner with linear Sustainable Urban Drainage Systems (SUDS-linears). Participation in this European project will make it possible to monitor the draining pavement at large for 4 years and adjust the theoretical values obtained and the real potential of this type of pavement.
Aurea Plumed
BRIGAID Connect builds on the EU-funded BRIGAID project. It has been created as an independent by several members of the consortium to further exploit the project’s methods, knowledge and networks. BRIGAID CONNECT offers a one-stop-shop for supporting climate adaptation innovations. BRC is the expert’s platform that strives to help innovators to market and launch their resilience ideas by supporting climate innovators to transfer their ideas into implementable solutions through a full range of support services: access to testing facilities for prototypes, guidance on business strategy development and marketing communication, and engagement in Communities of Innovation - all developed and proven in the 2016-2020 research project, BRIGAID. BRC help innovators to take their resilient solutions to the communities. We connect them with those in need of ideas to prevent the threats of our century. BRC has a wide range of actors and stakeholders on board and a magic strategy of developing an active map of innovators, end-users, investors, funders, and experts.
BRIGAID Connect in MULTICLIMACT has an important role of integrating the projects innovations and demo cases in the online market Climate Innovation Windows and this will be done through a good expertise and support of the stakeholders and all the partners.
Camerino, situated in central Italy, encompasses a rich tapestry of historical and cultural landmarks, including medieval architecture and educational institutions like the University of Camerino. The town is surrounded by diverse natural landscapes, from the scenic Apennine Mountains to rural and agricultural areas, providing a picturesque backdrop. Camerino's urban and residential areas, complemented by green spaces and water features, contribute to its unique charm and appeal.
In the central area of Italy, where camerino is located, a maximum increase of 1 day in precipitation is noted, with a higher anomaly anticipated in the absence of mitigation policies, potentially elevating the risk of weather-induced landslides due to modified precipitation patterns and the vulnerability of the region. Simultaneously, there is an expected significant rise in heating degree days and heat waves for this area and other Italian regions. Regarding earthquakes, the Civil Protection classifies seven Italian regions, including Marche, as high risk due to a high probability of seismic activity.
The Italian demo site is set to implement various components from the MULTICLIMACT toolkit, providing valuable insights for potential replication. This is particularly crucial in Italy, given the extensive seismic risk across a broad area, as well as in other countries using similar construction techniques, alongside addressing individualized climate-related hazards. The project encompasses resilient energy retrofit interventions for climate-proofing the built environment, human-centered design to enhance health and well-being, innovative materials like self-sensing EECs and eco-friendly mortar, and digital solutions including a Decision Support System for natural disaster prevention and damage estimation.
CMCC is an international research centre established in 2005 with the financial support of the Italian Ministry of Education, University and Research, and the Ministry of the Environment, Land and Sea, and it has been fully operative since 2006. On 10 December 2015, the Center became a Foundation, representing CMCC’s legal status, contents, aims and operational modalities.
CMCC collaborates with experienced scientists, economists, and technicians who work together to provide full analyses of climate impacts on socio-economic systems. CMCC also supports policymakers in setting and assessing costs, mitigation, and adaptation policies. Furthermore, the Foundation promotes and carries out basic and applied scientific research and develops operational services with a high content of knowledge and technological innovation in the various fields on which climate change has an impact, favouring collaboration between universities, national and international research bodies, local authorities and manufacturing sectors.
Specifically, activities in MULTICLIMACT are performed by the REMHI (REgional Models and geo-Hydrological Impacts) division of CMCC. The REMHI division conducts research and provides services related to local climate change and impact assessment, as well as support for defining adaptation actions and climate risk management. The division comprises four units, each with a specific focus:
The Regional Model unit develops and utilizes regional climate models through participation in international programs to constantly improve knowledge on expected climate change condition at the local level. These analyses can also support the evaluation of the impact of climate change on various sectors and aid adaptation analyses.
The Adaptation Engineering unit updates and improves analytical tools and assessments used in traditional civil engineering to address climate change challenges.
The Climate Service unit offers constantly updated climate tools and services, also available thanks to the GIS platform Dataclime (www.dataclime.com) to study and tackle climate hazards and risks at the local level also including development of climate statistical downscaling tools.
The Urban Risk and Adaptation unit develops and applies frameworks for evaluating climate risks and advancing knowledge on planning, designing, and managing adaptation solutions in urban settings.
REMHI division of CMCC is involved in several activities within 16 WPs. To achieve the expected project’s outcomes, it will leverage an interdisciplinary team of experts in climate science, engineers, architects, and ICT experts, drawing on past and ongoing
experiences related to the themes addressed (e.g., https://www.cmcc.it/research/research-institutes/regional-models-and-geo-hydrological-impacts). In phase 1 “PLAN AND DESIGN”, CMCC leads the development of MULTICLIMACT toolkit assessment framework with the elaboration of quantitative (KPI-based) methods to assess the impact of the
implementation of interventions (T1.2) and the planning and designing of adaptation policies and measures for enabling a climate-proof built environment at different scales (T2.1).
Moreover, in phase 1, CMCC supports the activities related to: i) the creation of a set of planning and designing methods in the WP2 (improvement of the built environment resilience by accurately accounting for supply chains - T2.2; energy retrofit interventions - T2.4; improvement of citizens’ health in terms of physical, mental and social well-being -T2.5): ii) the development of materials and technologies in the WP3 (improvement of buildings resilience, including cultural heritage – T3.3); iii) the design and advancement of digital solutions in the WP4 (prevention and damage estimation of natural extreme events consequence at different scales – T4.1; climate-proof characterisation of thermal and energy solutions – T4.3). CMCC is also involved in mapping similar projects, relevant initiatives and international processes (T5.4).
In phase 2 “DEVELOP AND TEST”, CMCC leads the development of the application to a real demo case by translating the methods and best practices developed in T2.1 into the real context of the Spanish demo (T8.2). Moreover, CMCC supports the development of the CREMA tool (T7.1, T7.2), the application to a Latvian (T8.2, T9.3) and Italian demo cases (T8.4, T8.5, T9.3) and the demonstration of the MULTICLIMACT framework both at the building (T11.1) and urban scale (T11.2).
In phase 3 “DEPLOY AND REVISE”, CMCC contributes to the revision of the CREMA tool (T14.1, T14.2) and deployment of the MULTICLIMACT framework both at the building scale (T15.1) and urban scale (T15.2). CMCC is also involved in national and EU-level policy recommendations and engagement in standardisation activities (T16.5).
Finally, with all other partners, CMCC is involved in outreach activities and project coordination: i) communication and dissemination strategy (T5.1, T12.1, T16.1); ii) MULTICLIMACT promotional material and website (T5.2); iii) exploitation strategy (T5.3); iii) market uptake (T12.2, T16.2); iv) international outreach, cooperation, and peer learning amongst LLGs (T12.4); v) replicability, scalability and international cooperation (T16.3); vi) administrative and financial project coordination (T6.1, T13.1, T17.1); vii) scientific and technical coordination (T13.2, T17.2); viii) quality assessment, ethics, data and risk management (T6.3, T13.3, T17.3).
COMSA, the parent company of COMSA Corporación, is a leading construction company in Spain with a solid presence in Europe and Latin America. For more than 130 years, it has been a specialist in railway projects that cover the construction and maintenance of high-speed lines, trams, metropolitan and regional railways, as well as in the field of civil works and singular buildings.
In turn, COMSA Corporación is a global infrastructure, industrial engineering and services group, with a turnover of €886M and a workforce of more than 5,000 people. Committed to sustainability and responsible growth, it aligns its objectives with the United Nations SDGs and puts its knowledge at the service of society in large-scale projects with a high technological component. Thus, it is positioned among the main innovative companies in the sector through the development of new materials and techniques for the execution and management of infrastructures.
COMSA is responsible for the demonstration site in Barcelona and will develop an asphalt pavement with recycled glass to reduce the effects of the heat island.
CYPE’s journey began in 1983 with an intense activity in the field of engineering and structural analysis, which motivated the computer development of applications to cover its own needs and those of its clients. The success of these programs led the company to concentrate its activity in the development, commercialisation and distribution of technical software.
As a result of this work, CYPE occupies a leading position within the sector, offering a variety of programs that stand out due to the wide range of casuistry that is dealt with, the reliability of the results and the ease with which they can be managed, with over 170.000 users spread across Europe, America, Africa, Oceania and Asia. Amongst our clients are town councils and ministries, as well as technical control organisations, universities and professional offices.
CYPE will contribute in MULTICLIMAT project with its software solutions for simulation of structural and energy behaviour under extreme conditions and natural hazards.
ENEA is the National Agency for New Technologies, Energy and Sustainable Economic Development, a public body aimed at research, technological innovation and the provision of advanced services to enterprises, public administration and citizens in the sectors of energy, the environment and sustainable economic development. ENEA focus on sectors including energy technologies including renewable sources, energy storage, smart grids, for which the Agency is also the coordinator of the Energy National Technology Cluster, nuclear fusion and nuclear safety, energy efficiency, technologies for cultural heritage, seismic protection, food safety, pollution, life sciences, strategic raw materials, climate change.
ENEA's main objective will be the design and implementation of new features of the CIPCast Decision Support System, a platform for the risk analysis of Critical Infrastructures subject to natural risks. The demonstration of the interoperability capacity between CIPCast and other digital solutions provided by other partners will be carried out through the implementation of the ENEA Smart City platform. Furthermore, ENEA will develop a series of new materials applicable on building envelopes to mitigate the impact of the global alarm and the growing demand for cooling.
fibrisTerre is a leading manufacturer of Distributed Fiber Optic Sensing instrumentation, providing long-range, uninterrupted structural monitoring for built and natural structures. Detecting and locating tiny changes in strain and temperature continuously with its patented Brillouin technology, fibrisTerre takes the next step in reliability and ease of use, providing valuable insight into critical assets’ condition in applications such as geotechnics and structural engineering, renewable energy, transportation, mining, pipelines, boreholes, power cables and more.
Integrity monitoring of flood protection structures along coasts and rivers is a core element to assure climate resilience in rural and urban areas. Within the MULTICLIMACT consortium, fibrisTerre provides the knowledge, the equipment and the data transmission infrastructure for a distributed fiber-optic monitoring system for flood protection along dikes and embankments. The monitoring data feeds TU Delft’s digital twin and dike monitoring dashboard as a comprehensive real-time tool for assuring safety of flood defence structures.
ICLEI – Local Governments for Sustainability is a global network working with more than 2,500 local and regional governments committed to sustainable urban development. Active in 125+ countries, ICLEI influences sustainability policy and drives local action for low emission, nature-based, equitable, resilient and circular development. ICLEI's Members and team of experts work together through peer exchange, partnerships and capacity building to create systemic change for urban sustainability.
The European Secretariat of ICLEI (ICLEI Europe) represents local and regional governments and cooperates with European networks, the European Commission, the Committee of the Regions and others to shape the debate on urban sustainability policies and legislation. ICLEI Europe has a wide range of expertise in sustainable urban governance, public procurement, circular economy and waste, cultural heritage, climate change mitigation and adaptation, nature-based solutions, urban water management, smart cities, mobility, infrastructure, food, urban resilience, energy transition, social justice and social innovation. ICLEI Europe connects local and regional governments with solution providers, through collaboration on European and national-scale projects, technical consultation, multidisciplinary training, events and information and communication services, to facilitate the implementation and replication of sustainable solutions.
In MULTICLIMACT, ICLEI Europe has a key role in the creation of the MULTICLIMACT mainstreamed resilience framework, the resilience scorecard method, and the CREMA tool, which is used for the assessment of the resilience of a particular built environment. ICLEI also contributes to the outreach and promotion of the uptake of project outcomes both during and after the project lifetime, as well as ensuring cooperation at the European and International levels.
Selene Angelone
Vasileios Latinos
Hoogheemraadschap Delfland is one of the 21 waterboards in the Netherlands, responsible for water management in the Delfland region.
As a water board, we work towards a safe and clean environment when it comes to water. This is achieved by working on strong dikes and dunes, maintaining appropriate water levels, purifying wastewater, and ensuring sufficient clean and healthy water.
Delfland provides a flood defence that can be used for conducting research using a microfiber calbe.
KTH is a university and public authority with activities are separated into different Schools: architecture and the built environment, electrical engineering and computer science, engineering sciences, chemistry, biotechnology and health and industrial engineering and management.
Since 1827, KTH has grown to become an international leading technical university. As the largest institution in Sweden for technical education and research, it brings together students, researchers, and educators worldwide. Our activities are grounded in a strong tradition of advancing science and innovation, focusing on contributing to sustainable societal development
As part of MultiClimact the Schools of architecture and Built Environment as well as Industrial Management and Engineering are collaborating in order to contribute to the project in two areas: the design and evaluation of impacts of 1) HTC/LTH (High Temperature Cooling/Low Temperature Heating) solutions that can exploit Renewable Energy Sources, and 2) robust and resilient supply chains that will have to address the future needs of materials for the Built Environment.
LiS, an innovative startup and spin-off of UNIVPM, develops a software platform to transform buildings into intelligent and sensory structures, capable of enhancing the well-being of people inside and the sustainability of the built environment.
Live Information System's role is to design a digital solution for the multi-purpose monitoring of environmental and structural behaviour of buildings.
Within the Multiclimact project, we anticipate the LiS-Platform to become the cornerstone for smart buildings. Through real-world testing, we will showcase our capacity to create and manage future-ready, resilient city structures.
Naturalea is specialized in landscape restoration, and it is a cutting-edge nationwide company in the field of implementation of bioengineering techniques, both traditional naturalistic engineering and biophysical or structural vegetable engineering, with over 26 years of experience in the sector and having more than 1000 developed projects.
Naturalea is testing a new bio-retention swale within the framework of the MULTICLIMACT project with the main aim of creating strategies to mitigate the heat island effect. This solution is going to be monitored in an open-air laboratory to assess its effectiveness. Naturalea with other partners is involved in the demonstration site of Spain with the main goal to mitigate the heat island effect due to the climatic crisis that we are facing.
NCSRD- is a multidisciplinary research Institution pursuing basic, translational and applied research to address challenges of great scientific and socioeconomic impact in a broad spectrum of scientific and technological fields. With its highly qualified staff and large scale, unique nationwide facilities, NCSRD satisfies the necessary conditions and possesses the potential to achieve critical masses and direct synergies among the various labs and research groups under wide thematic areas creating significant growth prospects and bringing clear socio-economic benefits.
The Environmental Research Laboratory (EREL) of NCSRD is an established RTO combining complementary expertise in atmospheric research and environmental decision support systems with important research potential (awarded the largest FP7-REGPOT ENTEC for climate research and coordinating the H2020 project EU-CIRCLE). EREL follows an integrated R&D approach to environment and climate, contributing to environmental protection and sustainable development in regional and global terms. R&D in climate change and regional models, dynamical downscaling –very high resolution climate modelling for Greece-, statistical and AI/ML downscaling, prognostic - diagnostic meteorology and data assimilation, dispersion of air pollutants, decision support systems integrated with advanced multi-hazard risk analysis and impact assessments are subjects of major research focus. The group has also strong know-how on mitigation/ adaptation and disaster reduction activities such as:
Extreme and compound events/ climate related risks /causality & attribution of climate patterns/ forecasting & climate indicators for hydrometeorological hazards
Weather-climate sensors in cities / nature-based solutions in infrastructures
Fire Risk modelling: seasonal & climatic analyses
Definition of emergency response plans and specific mitigation measures
Strategic risk and climate resilience analysis on heterogeneous interconnected critical infrastructures, cities and communities & the agricultural sectors
Development of environmental-energy-economic nexus based on the Input-Output Analysis
NCSRD is the leader of WP7, which aims at the development of a mainstreamed resilience framework for supporting the built environment adaptation to climate change. NCSRD is also the leader of Task 2.4 which aims at the planning and designing of resilient housing and Task 8.4 which addresses the translation of the planning methods and design concepts developed in Task 2.4 into real context of the Italian demo. In addition, NCSRD contributes to data driven modelling for predicting key performance indicators (Task 4.3). Moreover, NCSRD contributes to MULTICLIMACT with desk review analysis and data supply addressed in several tasks (Tasks 1.1, 1.2, 1.3, 2.1, 2.2, 4.3, 7.1, 7.2, 7.3, 8.1, 8.2, 11.1, 14.1, 14.2, 15.1 and 16.5).
RINA is a global company with over 5,300 employees worldwide, dedicated to simplifying complexities with a focus on energy transition, sustainability, and digitalisation. Specialising in providing testing, inspection, certification, and engineering solutions across various markets, including Marine, Energy and Mobility, Real Estate and Infrastructure, Space and Defense, and Industry 4.0, RINA collaborates with clients to address complex challenges and leverages its experience to anticipate and overcome obstacles. The company is strongly oriented towards innovation and has achieved recognition as the second top industrial participant in H2020 across the European Union. With a remarkable track record of over 500 R&D and industrial innovation projects successfully completed in the last decade (2012-2022) and securing a substantial total funding of over €150 million for these endeavors, RINA maintains an extensive collaborative network of over 5,000 partners, demonstrating their commitment to research and innovation on regional, national, and EU levels. The ultimate goal is to enhance the quality of life and build sustainable values for future generations, achieved through the expertise, knowledge, and a dedicated team capable of offering innovative solutions to complex problems and successfully completing ambitious projects.
RINA serves as the coordinator of the MULTICLIMACT project and leads several Work Packages related to project coordination throughout the project's duration, as well as the revision of the Mainstream Resilience Framework developed within the project. The primary objective is to efficiently coordinate the project, facilitating seamless collaboration among partners and ensuring successful outcomes. RINA also aims to deliver three exploitable results for commercial activities: i) the Climate REsilience Maturity Assessment (CREMA) tool for enhancing resilience in diverse contexts, scales, natural hazards, and locally scaled future climate scenarios, ii) life cycle methods supporting planning and design of resilience-enabling interventions in the built environment across multiple scales, and iii) a climate-proofing energy planning solution for urban energy planning. Additionally, RINA actively builds collaborative synergies with other resilience-focused R&D projects within the Built4People partnership and relevant clusters.
TECNALIA is a benchmark centre in Europe for applied research and technological development. Based in the Basque Country, it is the leading Spanish organisation in contracting, participation, and leadership in the Horizon Europe programme. TECNALIA collaborates with companies and institutions with an increasingly strategic business relationship model based on trust, collaboration, and a shared technological approach through many scopes of action including smart manufacturing, digital transformation, energy transition, sustainable mobility, health and food, urban ecosystem and circular economy.
TECNALIA will contribute to the MULTICLIMACT project by developing a monitoring platform and a data-driven modelling tool for pavement solutions addressing urban heat island mitigation. The scalable monitoring system will allow continuous, real-time data acquisition controlling the performance of synthetic and nature-based pavement solutions, evaluating its mechanical and thermal performance. The digital solution will perform a full characterisation of the dynamic thermal performance of such pavement solutions when exposed to actual service conditions, enabling extrapolation of this real performance to other locations or future climate scenarios.
Delft University of Technology is the oldest, largest and most comprehensive university of technology in the Netherlands. With over 19,600 students and 2,600 scientists (including 400 full professors), it is an establishment of national importance and of significant international standing. The University collaborates on a structural basis with other international education and research institutes and has partnerships with governments, branch organizations, numerous consultancies, industry partners and companies from the small and medium business sectors. At the Hydraulic Engineering department in the civil Engineering faculty, we lecture, perform research, and develop engineering solutions for complex problems in water systems, like rivers, estuaries, coasts, seas and oceans. The students and researchers aim to better model, design and analyse water systems that provide flood protection, navigation, ecology services, freshwater supply, water quality and port operability for a better society.
Delft University of Technology has an important role on MULTICLIMACT on developing, testing and demonstrating the use of fiber optics sensing technology for monitoring and early warning of the structural health of fixed and movable flood defences during climatic shocks and stresses like high water events, rainfall storms and drought spells.
The University Hospital RWTH Aachen is the university hospital of the RWTH Aachen University. It is one of the largest hospital buildings in Europe with more than 30 years of experience in providing state-of-the-art medicine. The University Hospital can provide a comprehensive range of clinical services in addition to teaching and research. Due to its structure, which accommodates many disciplines and clinical fields under one roof, it encourages intense interdisciplinary exchange and collaboration. Until now, within the University Hospital, there are 36 specialist clinics, 33 institutes and six interdisciplinary units, which offer employment to more than 9,000 employees. The researchers involved in the MULTICLIMACT project are part of the Healthy Living Spaces lab, a multidisciplinary group within the Institute for Occupational, Social and Environmental Medicine.
UKA’s role within the MULTICLIMACT project is to enhance knowledge on human resilience within a building and to promote the investigation of subjective and objective assessment of health and well-being. The Healthy Living Spaces lab group encourages other researchers and practitioners to investigate resilience beyond the building context and to understand how a resilient building could influence human resilience. In addition to the skills and knowledge that researchers from UKA can provide, UKA will be leading Task 2.5, Task 8.5 and WP 8.
The University of Minho, a prominent public university in Portugal, is strategically located in the Minho region. As a cornerstone of development in this area, the university is pivotal in fostering regional growth and innovation. Among its notable establishments is the Institute for Sustainability and Innovation in Structural Engineering (ISISE), a distinguished Research and Development Centre founded in 2007. This institute represents a collaborative effort between the Civil Engineering Departments of the University of Coimbra and the University of Minho.
Priding itself on global inclusivity and academic excellence, ISISE comprises a diverse team. The institute is a melting pot of talents and cultures, hosting members from nearly every part of the globe. This diversity enriches our academic environment and reflects our commitment to international collaboration and inclusiveness. Our excellence in research and development was recognized in 2020 when ISISE was awarded an 'EXCELLENT' grade by FCT, the Portuguese Foundation for Science and Technology, highlighting our steadfast dedication to advancing the frontiers of structural engineering and sustainability.
The University of Minho, through its esteemed Institute for Sustainability and Innovation in Structural Engineering (ISISE), assumes a pivotal leadership role in Work Package 2 (WP2), titled "Design Practices and Methods for Supporting Natural Hazards Mitigation and Sustainability at Multiple Scales – Plan and Design." Our responsibilities encompass the coordination of WP2, providing comprehensive support to all partners involved in the work package, and ensuring seamless collaboration and progress. A significant part of our contribution is spearheading Task 2.6 and Task 8.6, which focuses on "Resilience-Enabling Interventions in Cultural Heritages (CH) for Buildings, Urban, and Rural Contexts." This task emphasizes our commitment to enhancing the resilience of cultural heritage sites in diverse settings, aligning with our overarching goal of promoting sustainability and hazard mitigation through innovative design practices.
The University of Camerino (UNICAM) is a ‘city campus university’ chartered in 1336, with about 600 staff, about 8,000 undergraduate students, and 180 PhD candidates, of which about 40% are foreigners. The five Schools of UNICAM carry on research and training activities in specific scientific fields: Architecture and Design; Science and Technology; Biosciences & Veterinary; Law; Pharmacy. Each School manages its activities in an international integrated cultural-oriented environment. Quality of student services and excellence in education and research are the main strategies of UNICAM.
Since 2005, UNICAM has adopted the European Charter for Researchers and a Code of Conduct for their Recruitment. UNICAM is national contact point for the Italian Euraxess portal for the mobility of researchers and one of the four Italian Universities to obtain the prestigious European acknowledgement “HR excellence in research” in 2010. Mobility and education funded projects (Erasmus, LLP etc.) and Cooperation Agreements with universities and institutions worldwide make possible for staff, researchers and students to participate in exchange and research programs. The Research, Technology Transfer and Project Management Area, recently established, supports researchers in project design, management and reporting of national and international research funded projects and IPR. After the 2016 earthquakes that seriously hit central Italy, including severe damages of Camerino historical buildings, the UNICAM Governance has start a process of Consortiums Building at national and International level driving attention on post-seismic reconstruction and cultural heritage.
Several research skills available within UNICAM Schools can be effective and interact in an interdisciplinary manner for the benefit of the project. The research activities of the School of Architecture and Design (SAD) comprise a wide range of disciplines: Survey, Representation, Theory and Design in Architecture, Technology in Architecture, Architectural History, Restoration and Cultural Heritage, Urban and Landscape Planning, Structural Engineering, Industrial Design and Communication Strategies. In this multi-disciplinary environment, constructive interactions and contaminations between approaches, methodologies and applications are naturally fostered. Among the interactions developed over the last years, special mention is made to the research groups active in the areas of Survey, History, Restoration, Cultural Heritage, and Structural Engineering, thanks to their successful collaborations in the development of integrated methodologies as well as practical applications to the seismic safety assessment of existing structures as well as to the seismic risk assessment of historical buildings and towns.
This multi-disciplinarity has led to production of relevant literature and access to several private and public, both national and European, funding. Special mention should be made to the Research Consortium REDI “Reducing Risks of Natural Disasters” led by UNICAM and very recently established together with other important research centres at national and international level, under the endorsement of the Italian Ministry of Research. REDI aims at matching the demand and supply of knowledge-for-action for a participatory approach to reduce risks of natural disasters, testifying the attention, interest and recognition of competences in the area of multi-disciplinary risk assessment.The team of the University of Camerino involved in this project is constituted by scholars in the area of Structural Engineering with a well-proven knowledge and experience on seismic design of steel structures and on structural Eurocodes. Large part of the research conducted by the group focuses on reliability, uncertainty propagation, risk assessment and structural resilience of new and existing structures including innovative solutions. The group has participated as partner and as coordinator within several national and international research and design projects interacting with research groups in Europe, US, China and Australia. Amongst others, the UNICAM group was previously involved in RFCS research projects, i.e., PRECASTEEL, STEEL-EARTH, INNO-HYCO, the latter as coordinator, HORIZON 2020 research with ARCH projects and currently HYCAD (2020-2023). Moreover, the group has been involved in various activities related to international code development and to committees formed by industry and other professional institutions/learned societies. Professor Andrea Dall’Asta is an expert nominated by the national standard body in the CEN-European Committee for Standardization, TC 250/SC 3/WG 13 “Evolution of EN 1993-2 – Bridges” and TC 250/SC 4/WG 3 “Evolution of EN 1994-2 – bridges”; he is also a member of the Structural Engineering commission, Vice-chairman of the Sub-Commission on Steel and Concrete composite structures of UNI-National Committee for Standardization. Professor Graziano Leoni is secretary of ECCSTC11 (Composite Structures) and corresponding member of FIB-SAG6 (Composite Steel-Concrete Construction) and IABSE-WC2 (Steel, Timber and Composite Structures).
University of Camerino will be actively engaged in the MULTICLIMACT project working synergically with all the involved partners in the plan, design, develop and testing of a mainstreamed framework of design methods, innovative materials and digital solutions for the assessment of resilience of the built environment and its people against climate and natural hazards and to support stakeholders in taking actions. In this framework UNICAM has a kay position as owner of Italian demo Fazzini a hosting students located in Camerino with a high value for its role in the educational ecosystem of the city seriously damaged by the seismic events of 2016 Central Italy Earthquake. Indeed, within the project, both built heritage of Camerino and the Italian demo Fazzini are going to experiment several components of the MULTICLIMACT solutions and toolkit extremely valuable in terms of potential replication.
In the first phase of plan and design, UNICAM will collaborate in different Tasks of WPs 1, 3 and 4. The specific activities will concern the collaboration in co-creation activities for the planning and design of MULTICLIMACT framework, giving a support on resilience assessment against seismic hazards within Task 1.3. In Task 3.3 UNICAM will support the design and development of innovative materials and technologies, focusing particularly on planning and design of the tests on resilience-enabling Engineered Cementitious Composites (ECCs) with self-sensing materials. UNICAM will be also involved in the activities of WP 4 collaborating to the design and implementation of digital solutions for prevention and damage estimation of natural extreme events consequences at different scales as well as for the multi-purpose monitoring of environmental and structural behaviour of buildings. In Task 4.1 UNICAM will provide an inventory of building of historical center of Camerino for the elaboration of seismic vulnerability assessment and damage prediction and hazard models that will be implemented into CIPCast for the elaboration of risk assessment and relevant maps at territorial level. In Task 4.2, Indications will be given about the typology of sensors to adopt in seismic monitoring system on a building scale to be implemented and managed within LIS platform.
UNICAM will actively take part in the activities of the second phase, giving a fundamental support in the assessment, development and planning methods, guidelines and tools for the correct implementation of the designed solutions and working for the development and planning the tests on Italian demo in Task 8.5 and 9.3. Further important activities will be carried out in Tasks 10.1 and 10.2, supporting the planning of the test and implementation of the digital solutions on the Fazzini building. Moreover, in this phase, UNICAM, as leading of Task 11.1, will be directly engaged in the organization of all the preparatory actions for facilitating the test of solutions at both building and territorial scale and will manage the interaction between the different technology providers, as well as the coordination of installations and testing.
These activities will continue during the third phase, in which UNICAM will coordinate task 15.1 for demonstrating the MULTICLIMACT framework on the Italian demo by deploying and monitoring all component of the toolkit installed at the building scale. Finally, UNICAM will collaborate with all partners in communication and dissemination activities and deal with other project management aspects in WPs 5, 6, 12, 13, 16 and 17.
Andrea Dall’Asta
Graziano Leoni
Alessandro Zona
Emanuela Merelli
Francesca Dezi
Michele Morici
Università Politecnica delle Marche (UNIVPM) is a public technical-scientific university with 5 study and research areas: Agriculture, Economics, Engineering, Medicine & Surgery, Sciences. Approximately, its administrative staff count 570 units while professors and researchers amount to 625 plus 250 postdocs. It is organised in 5 faculties and 12 departments, 7 of which have been awarded the National Seal of Excellence by the Italian Ministry of Higher Education in the last few years. The Department of Industrial Engineering and Mathematical Sciences (DIISM) is among these. In the current European Research and Innovation Framework, Horizon Europe, UNIVPM already has 31 funded projects. UNIVPM also joins many European partnerships and relies on its International Projects Service to support professors and researchers in finding research cooperation and mobility opportunities and managing the awarded funds in highly competitive global environments.
Within the framework of MULTICLIMACT project, UNIVPM develops innovative sustainable materials and measurement methods for improving the resilience of the built environment towards natural hazards, considering in particular seismic events. Moreover, also measurement strategies for the assessment of the occupants’ wellbeing in the built environment will be developed, considering both physiological and environmental sensors and also digital technologies.
Prof. Gian Marco Revel
Gloria Cosoli
Riga Energy Agency (REA) is a municipal agency founded in 2007 for the purpose of planning, management, monitoring and coordination of energy- and climate- smart and sustainable urban development. REA is engaged in full-cycle energy and climate policy development (planning-implementation-monitoring-evaluation-update) and has competences and expertise related to sustainable and resilient urban development – energy management, energy efficiency, shift to clean, renewable energy sources, energy retrofits, circular economy and many other fields.
Since its establishment REA has played an active role in the European policy development aimed to promote sustainable urban development and mitigate/adapt to the climate change. REA team has obtained invaluable knowledge and experience through implementing a range of EU projects financed by Horizon, Life, Intelligent Energy Europe, Interreg, URBACT, EUKI, EUCF and other funding sources.
The City of Riga has strong commitment to bringing the city closer to a smart, resilient and climate-neutral city’s status. Riga City Municipality has committed to achieving the status of a climate-neutral municipality already by 2030, ensuring that municipal institutions are as sustainable as possible with the least impact on the climate and municipal infrastructure is climate-neutral and resilient to the risks caused by climate change. Moreover, in 2022 Riga city was approved to join the mission of the first “100 Climate-Neutral and Smart European cities by 2030” and REA is the key responsible municipal structure to coordinate the participation of Riga city in this mission.
The Limburg Water Board is a regional authority responsible for the water management related elements for the Dutch province of Limburg. The water board ensures protection against flooding, management of surface water and ensuring sufficient water of good quality in the region. No other water board has a more varied area than ours: from sandy soils in the north to the southern hilly areas. The working area of the Limburg Water Board extends from Mook in the north to Eijsden in the south of the province of Limburg. The Limburg Water Board ensures safe dikes, dry feet, clean water and sufficient water in the province of Limburg. We do this with more than 400 employees. Our policy is determined by an elected board. The board members represent the interests of residents, companies and nature in our work area.
The Limburg waterboard will participate in the MULTICLIMACT project as an associated partner and has two main roles:
The first one is as to provide feedback based on their experience with the movable flood barriers systems so that the technology developed in this project will better satisfy the requirements from end users as themselves.
The second one aims to provide a real working environment such as the green river hydraulic diversion gate which will allow to test the fiber optic sensor based monitoring systems for movables barriers for validation of the technology in a relevant environment outside the lab.
At Uponor, we believe that water holds the key to a sustainable future. With a purpose to unlock its full potential and protect our planet, we are leading the change in sustainable water solutions. From cities and buildings to homes and the planet, we see ourselves as stewards of the world around us. With over a century of expertise and proven performance, we rise to meet the challenges of today with tomorrow’s innovations in delivering water safely and intelligently, while minimizing the use of energy and maximizing comfort. Partnering with our customers, we are committed to advancing their goals and moving water, innovation and our industry forward with an entrepreneurial spirit like no one else. We are dedicated to the idea that by moving water, we can reshape and accelerate the construction and performance of buildings and infrastructure, resulting in more sustainable homes, communities, and ultimately a healthier planet. We are a force for change, moving water to move the world.
UPONOR and KTH will work on innovations connected to HVAC solutions (HTC/LTH) able to exploit Renewable Energy Sources present on-site (e.g. ground water) for delivering energy-efficient and low-impact solutions also in cultural heritage buildings – i.e. adapting them to climate change while preserving their cultural identity and historic fabrics. In particular, such systems usage behaviours and interactive patterns to smart controls will be carried out and validated, by co-creation and other end-user engagement approaches.